Figure 1.
A Guide to DEBUG
The Microsoft® Windows™ .EXE
DOS Stub Program
Copyright©2004,2013 by Daniel B. Sedory
This page may be freely copied for PERSONAL use ONLY !
( It may NOT be used for ANY other purpose unless you have
first contacted and
received permission from the author ! )
In the early days of
Microsoft® Windows, The Windows™1.x, 2.x and 3.xx OS not only existed in the same volumes as Microsoft® DOS, but also ran on top
of an MS-DOS OS. It was not only possible, but very probable that a user might attempt to
run some of the Windows® programs under DOS. Therefore, Microsoft® programmers made sure all Windows® programs would have a simple 16-bit DOS
program placed at the front of each Windows executable that would alert the user if they were attempting to run a Windows® program under DOS. This is
all the DOS "Stub" program does.
One of the simplest .EXE programs you can run under DEBUG is the so-called DOS
"Stub" found inside hundreds of Windows® executables. The "Stub" program itself has not changed in many years, and we'll examine it in
detail in a Step-by-Step DEBUG session below. There are some ...
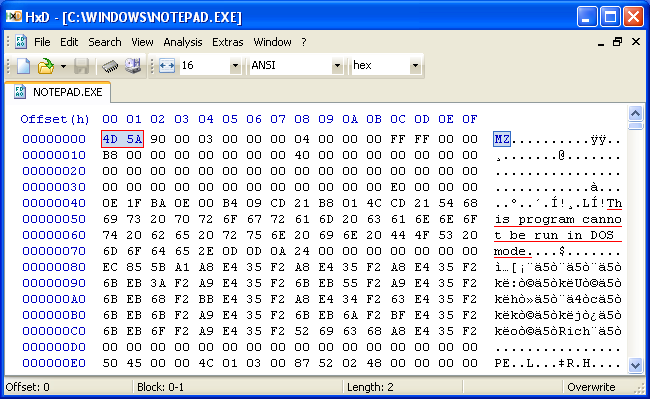
If you open a copy of NOTEPAD.EXE inside a Hex editor (such as HxD), it will appear similar to
this:
|
Figure 1. |
Note the first two bytes, "4d 5a" or their ASCII equivalent: "MZ". Whenever the DOS EXEC function is called to examine a file (anytime you load an .EXE or .COM program into DEBUG 2.0+ for example) and it finds "MZ" as the first two bytes, that file will always be considered an .EXE executable! So, what happens if you enter: debug notepad.exe at the prompt in a DOS-box? Well, the first bytes you'll see when you do a dump command are:
You may ask: "Hey, I thought DEBUG always loaded files from the command-line at offset 0100?" Well, if this were a .COM program, or any other kind of file, that did not have "MZ" as its first two bytes, it would. But, in the case of .EXE files, that isn't true. The EXEC function will examine an .EXE file's Header area, which among other things, determines the location of its first instruction (CS:IP) and also that of the Stack Pointer (SS:SP). In this case, the DOS header told EXEC to set the IP register to zero and load its code at offset zero.
Before proceeding with DEBUG, we should mention Windows® executables can be very complex when
compared to the .COM and even 16-bit .EXE programs you'd normally study with DEBUG. When we load NOTEPAD.EXE into DEBUG, its length is given as 68,608
bytes (BX:CX = 10C00 hex). We already told you that its actual size is 69,120 bytes. From Figure 1 above, which shows the actual beginning of
the program, we see the first 64 bytes (40h) weren't loaded into DEBUG; these are NOTEPAD's DOS Header. But, 68,608 plus 64 equals only
68,672 bytes, appearing to leave 448 bytes unaccounted for. The reason is because the DOS Header contains different information about
this file than its Windows® PE Header! We warned you this file's structure was complex. This particular program's PE (Portable
Executable) Header according to a particular 'file scanner' we used, says the file has the following pieces:
Stub: 224 bytes, Header: 800 bytes, Image: 68,096 bytes, Overlay: 0. Those add up to our file size of 69,120 bytes. Yet the DOS Header information
shows only a Header of 28 bytes (obviously not the whole DOS Header area!), Relocations: 0, Empty: 36 bytes, Image: 1104 bytes, Overlay: 67,952; which
adds up to the same total. At some time in the future, we might create a few pages dealing with all this header information and how to interpret it.
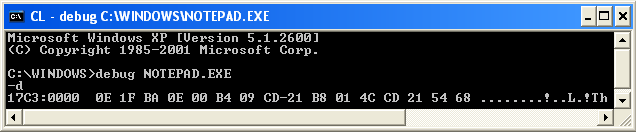
Offset 0 1 2 3 4 5 6 7 8 9 A B C D E F 000000 4D 5A 90 00 03 00 00 00 04 00 00 00 FF FF 00 00 MZ.............. 000010 B8 00 00 00 00 00 00 00 40 00 00 00 00 00 00 00 ........@....... 000020 00 00 00 00 00 00 00 00 00 00 00 00 00 00 00 00 ................ 000030 00 00 00 00 00 00 00 00 00 00 00 00 E0 00 00 00 ................ 000040 0E 1F BA 0E 00 B4 09 CD 21 B8 01 4C CD 21 54 68 ........!..L.!Th 000050 69 73 20 70 72 6F 67 72 61 6D 20 63 61 6E 6E 6F is program canno 000060 74 20 62 65 20 72 75 6E 20 69 6E 20 44 4F 53 20 t be run in DOS 000070 6D 6F 64 65 2E 0D 0D 0A 24 00 00 00 00 00 00 00 mode....$....... 000080 EC 85 5B A1 A8 E4 35 F2 A8 E4 35 F2 A8 E4 35 F2 ..[...5...5...5. 000090 6B EB 3A F2 A9 E4 35 F2 6B EB 55 F2 A9 E4 35 F2 k.:...5.k.U...5. 0000A0 6B EB 68 F2 BB E4 35 F2 A8 E4 34 F2 63 E4 35 F2 k.h...5...4.c.5. 0000B0 6B EB 6B F2 A9 E4 35 F2 6B EB 6A F2 BF E4 35 F2 k.k...5.k.j...5. 0000C0 6B EB 6F F2 A9 E4 35 F2 52 69 63 68 A8 E4 35 F2 k.o...5.Rich..5. 0000D0 00 00 00 00 00 00 00 00 00 00 00 00 00 00 00 00 ................ 0000E0 50 45 00 00 4C 01 03 00 87 52 02 48 00 00 00 00 PE..L....R.H.... 0000F0 00 00 00 00 E0 00 0F 01 0B 01 07 0A 00 78 00 00 .............x.. Figure 3. |
The following illustrations show exactly what happens when you use DEBUG to step through almost any Windows (not just NOTEPAD) program using the following DEBUG commands (Note: The Segment values on your computer will most likely vary from those shown here):
C:\WINDOWS>debug notepad.exe
-r
First we enter the R command, to bring up the Registers display!
AX=0000  BX=0000  CX=C510  DX=0000  SP=00B8  BP=0000  SI=0000  DI=0000
DS=0B5C  ES=0B5C  SS=0B6C  CS=0B6C  IP=0000   NV UP EI PL NZ NA PO NC
0B6C:0000 0E            PUSH    CS
Note the CX Register above. This tells us the executable portion of NOTEPAD has a length of C510h (or 50,448) bytes; at least that's how EXEC interpreted the DOS header. But this value cannot be trusted for a complete picture of Windows executables. The Data Segment (DS Register) is 0B5C, Code Segment (CS) is 0B6C and the Instruction Pointer (IP) is at 0000. Each time an instruction is executed, the IP value will change. This first instruction will push the value of the CS Register onto the Stack. After entering the Trace (-t) command, you should see the following:
AX=0000  BX=0000  CX=C510  DX=0000  SP=00B6  BP=0000  SI=0000  DI=0000
DS=0B5C  ES=0B5C  SS=0B6C  CS=0B6C  IP=0001   NV UP EI PL NZ NA PO NC
0B6C:0001 1F            POP     DS
Before continuing, let's take a quick look at the Stack. You can see above that the Stack Pointer (SP) changed from 00B8 to 00B6. Stacks always fill-up (push) and get depleted (pop) in much the same manner as a spring-loaded tray rack at a cafeteria. Once a memory location has been assigned to the first byte in a Stack, every byte added to the Stack will subtract one from the Stack Pointer (SP). In this case, a Word (of two bytes) was added to our Stack. Since the Stack Segment (SS) is set to 0B6C, but our Data Segment is still at 0B5C, we'll do a Dump of b6c:00b6 to b8 here:
-d b6c:00b6 b8 0B6C:00B0 6C 0B-00 l.. |
Note that values which contain more than one byte, such as this Word 0B6Ch, are always stored in Memory with the Least Significant Byte first! Let's carry out another Trace:
AX=0000  BX=0000  CX=C510  DX=0000  SP=00B8  BP=0000  SI=0000  DI=0000
DS=0B6C  ES=0B5C  SS=0B6C  CS=0B6C  IP=0002   NV UP EI PL NZ NA PO NC
0B6C:0002 BA0E00        MOV     DX,000E
The POP instruction moved 0B6C from the Stack to the DS Register, and changed the SP Register back to 00B8. And now that the Data Segment has been changed to the same value as the Code Segment, we can do a Dump of Offset 000Eh (and following) to see why the program wants to load that value into the DX (Data) Register. Enter the command "d 0e 38" and you should see:
-d 0e 38 0B6C:0000 54 68 Th 0B6C:0010 69 73 20 70 72 6F 67 72-61 6D 20 63 61 6E 6E 6F is program canno 0B6C:0020 74 20 62 65 20 72 75 6E-20 69 6E 20 44 4F 53 20 t be run in DOS 0B6C:0030 6D 6F 64 65 2E 0D 0D 0A-24 mode....$ |
We already knew that the string data would end with a "$" sign, so went ahead and used offset 38h as the last location for the Dump command. These are the ASCII bytes and the characters they represent (shown on the right-side of the display). Although many non-displayable bytes are shown as 'dots' in the ASCII part of DEBUG's Dump display, a "2Eh" byte (shown in light blue above) is the real ASCII value for a period (punctuation character). The yellow 'dots' show the non-displayable characters, 0Dh and 0Ah, which are a Line Feed and Carriage Return, repectively. We'll comment on the 24h byte below. Yet another Trace (-t) command gives us:
AX=0000  BX=0000  CX=C510  DX=000E  SP=00B8  BP=0000  SI=0000  DI=0000
DS=0B6C  ES=0B5C  SS=0B6C  CS=0B6C  IP=0005   NV UP EI PL NZ NA PO NC
0B6C:0005 B409          MOV     AH,09
-t
Before you carry out the next instruction, you need some information: INT 21h executes DOS Interrupts; in this case, Function 09h (because AH=09). You should never use the Trace command on Interrupts! (Unless you really do want to attempt stepping through all of the MS-DOS code that comprises one.) Basically, Function 09 of INT 21, will print out a string of characters (at an offset pointed to by the DS:DX registers), until it encounters a 24h ("$") byte. After entering the Proceed command, you should see the string displayed on your screen as follows:
AX=0900 BX=0000 CX=C510 DX=000E SP=00B8 BP=0000 SI=0000 DI=0000 DS=0B6C ES=0B5C SS=0B6C CS=0B6C IP=0007 NV UP EI PL NZ NA PO NC 0B6C:0007 CD21 INT 21 -p This program cannot be run in DOS mode. |
AX=0924  BX=0000  CX=C510  DX=000E  SP=00B8  BP=0000  SI=0000  DI=0000
DS=0B6C  ES=0B5C  SS=0B6C  CS=0B6C  IP=0009   NV UP EI PL NZ NA PO NC
0B6C:0009 B8014C        MOV     AX,4C01
This is yet another DOS Interrupt (INT 21h) in the making... Function 4Ch (AH=4C) is the standard "Exit" (Terminate) code with Return (AL=return value; 01 in this case). By now, you should see that it's very important to obtain a list of all the Interrupts! Look for the link to Ralf Brown's (Free) Interrupt Listing on our Assembly page.
-t

AX=4C01  BX=0000  CX=C510  DX=000E  SP=00B8  BP=0000  SI=0000  DI=0000
DS=0B6C  ES=0B5C  SS=0B6C  CS=0B6C  IP=000C   NV UP EI PL NZ NA PO NC
0B6C:000C CD21          INT     21
-p

Program terminated normally
-q
As you can see, the "Program terminated normally" and we Quit the DEBUG session.
There are variations of the "DOS Stub" program in existence. Basically they depend upon which software company made the compiler that was used to create a Windows® program. For example, the string displayed by a program which used Borland's tlink32 compiler, should state: "This program must be run under Win32." when run under a real 16-bit DOS or in DEBUG.